The Analytics and Reports section provides access to a comprehensive range of analytical and financial reports within the system. These tools help administrators, managers, and medical staff evaluate clinic performance, staff productivity, revenue, and patient activity.
Each report includes customizable filters, period selectors, hierarchy views, and Excel export options to ensure maximum flexibility and data transparency.
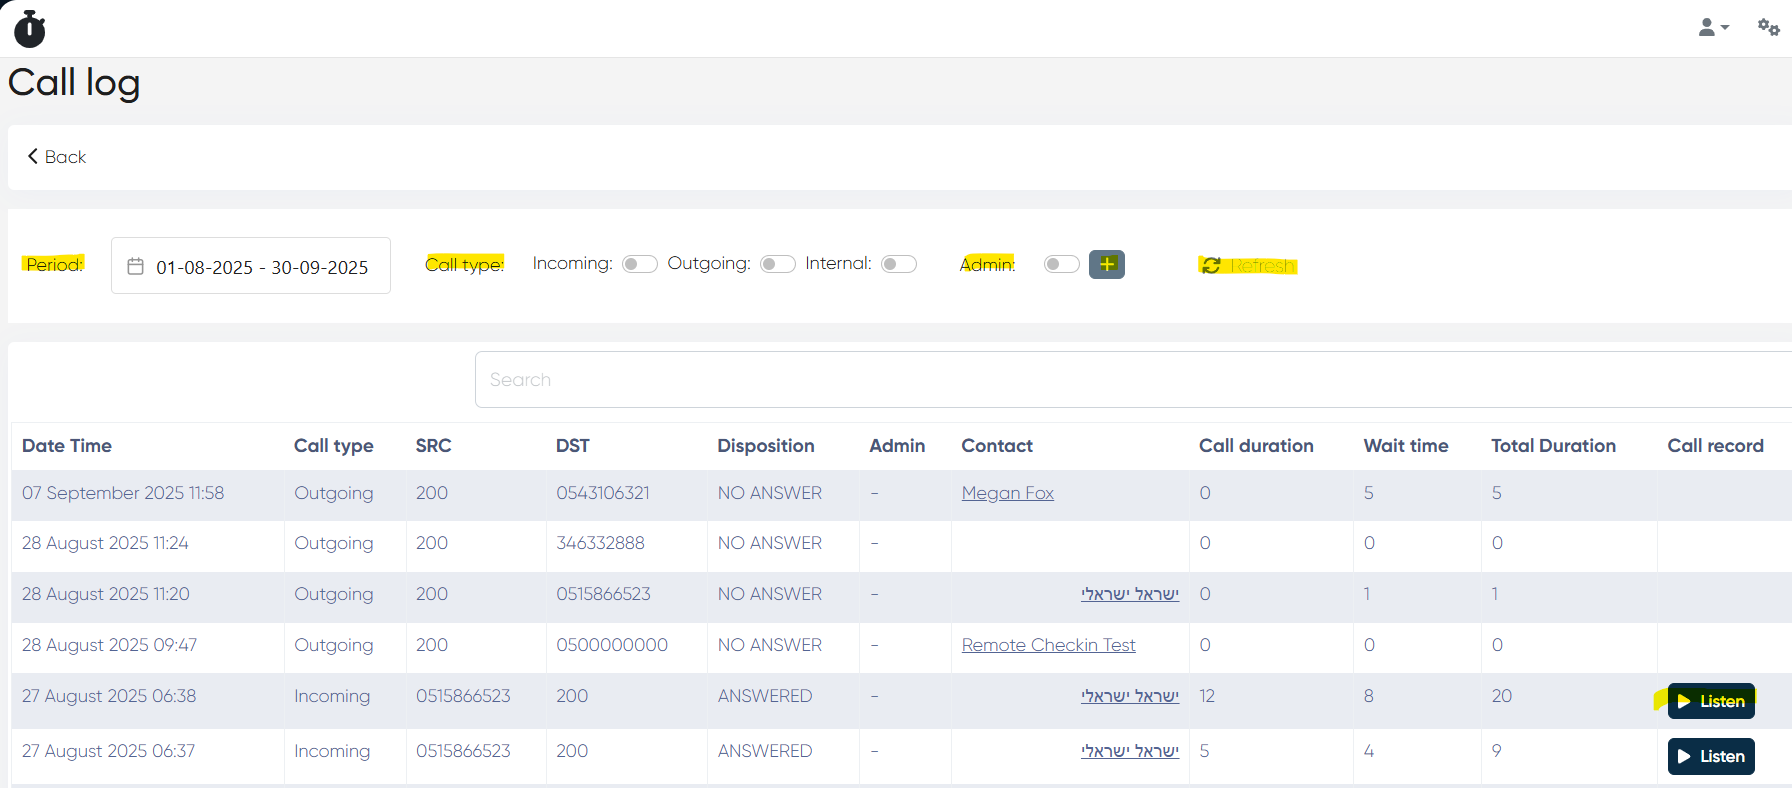
1. Call Log
Navigation: Analytics > Call Log
Displays the complete log of all incoming, outgoing, and internal calls handled by the system.
Filters and Controls
Period: via calendar picker
Call Type: Incoming / Outgoing / Internal
Admin Filter: Toggle + add administrator
Refresh / Search Bar for quick lookup.
Report Table
Column
Description
Date/Time
Call timestamp
Call Type
Type of call
SRC / DST
Source and destination numbers
Disposition
Answered / No Answer
Admin
Responsible staff
Contact
Linked contact from CRM
Call Duration / Wait / Total Duration
All in minutes
Call Record
Playback option with adjustable speed
Use case: Review call activity, staff responsiveness, and service efficiency.
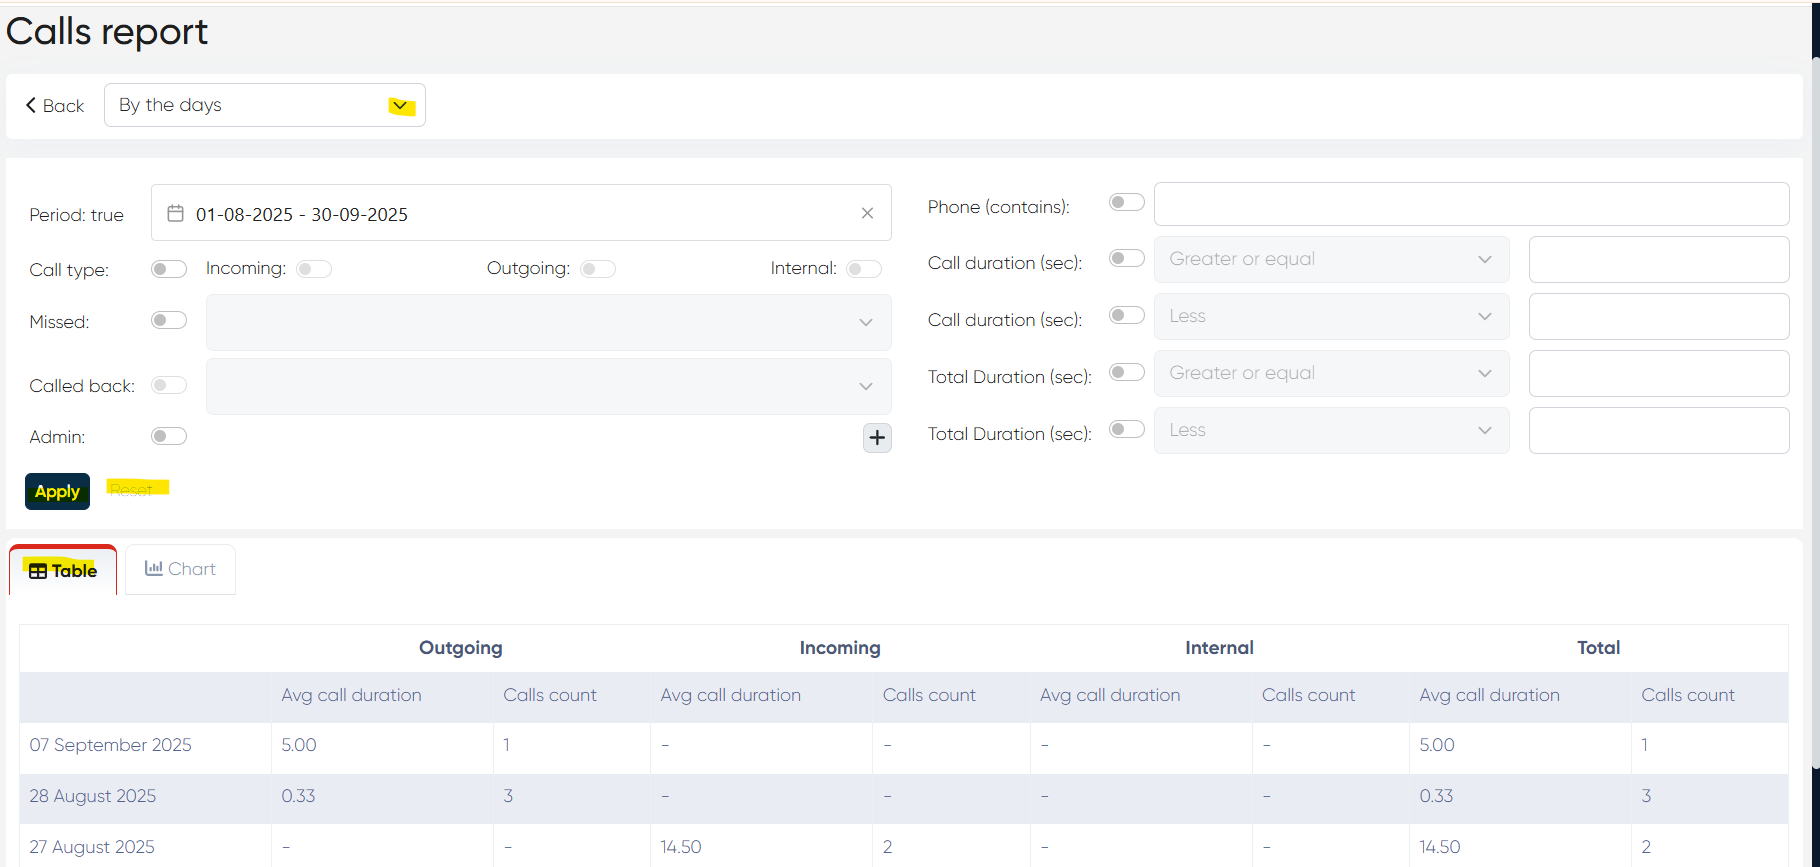
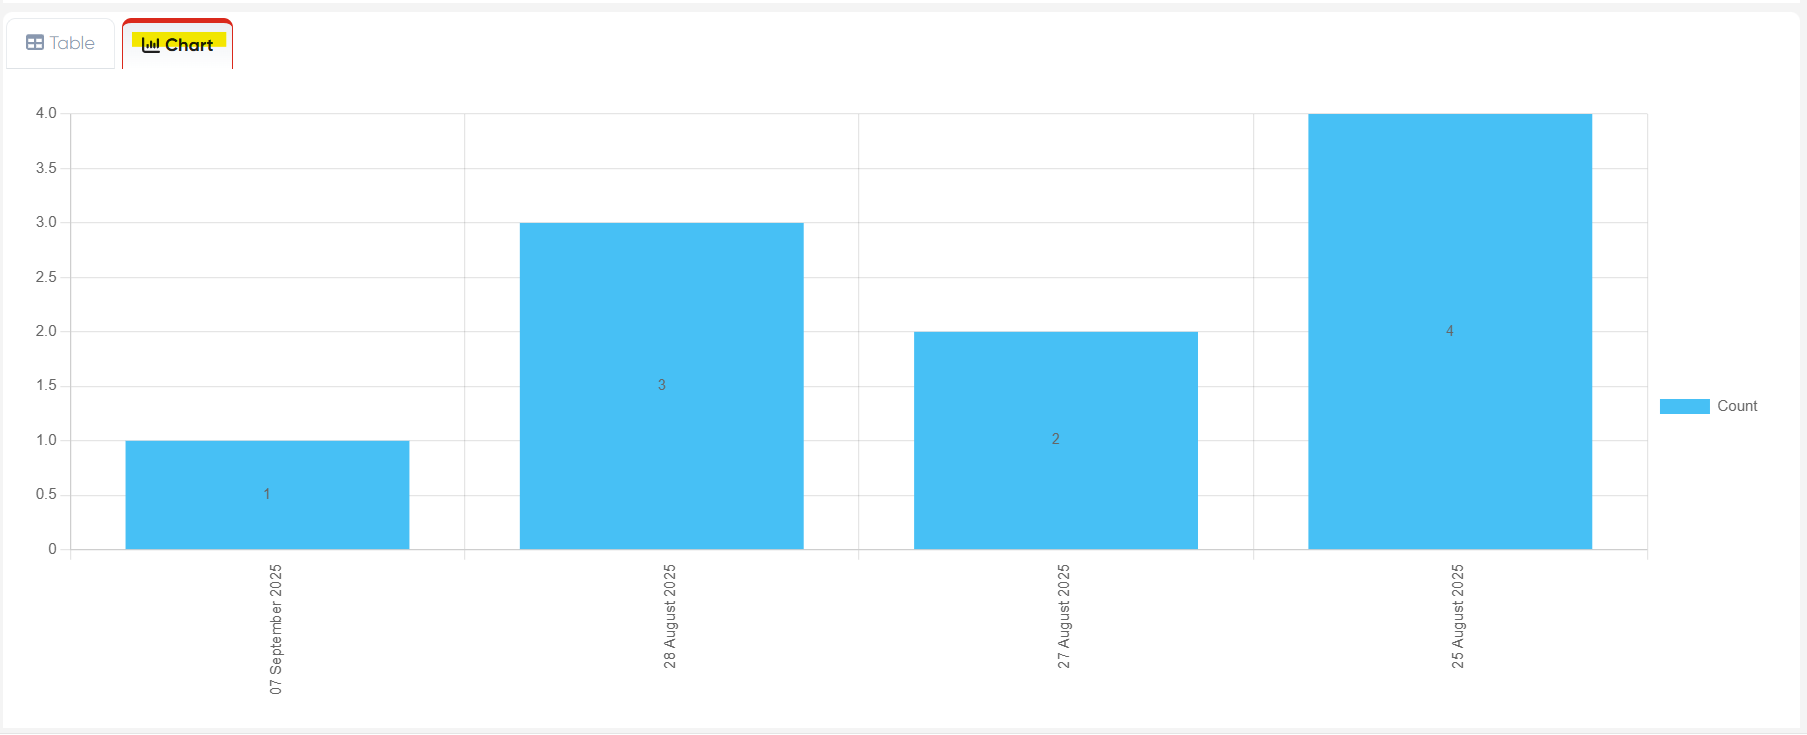
2. Calls Report
Navigation: Analytics > Calls Report
Provides a summarized analysis of all call activity in different time and employee breakdowns.
Filters and Controls
View: By hours / days / months / employees
Period: via calendar
Call Type, Missed, Called Back toggles
Admin Filter / Duration Filters (sec)
Apply / Reset
Report Views
Table View: Avg. duration + count per call type (Incoming, Outgoing, Internal)
Chart View: Visual call distribution (X-axis: period, Y-axis: number of calls)
Use case: Evaluate call traffic patterns and operator workload.
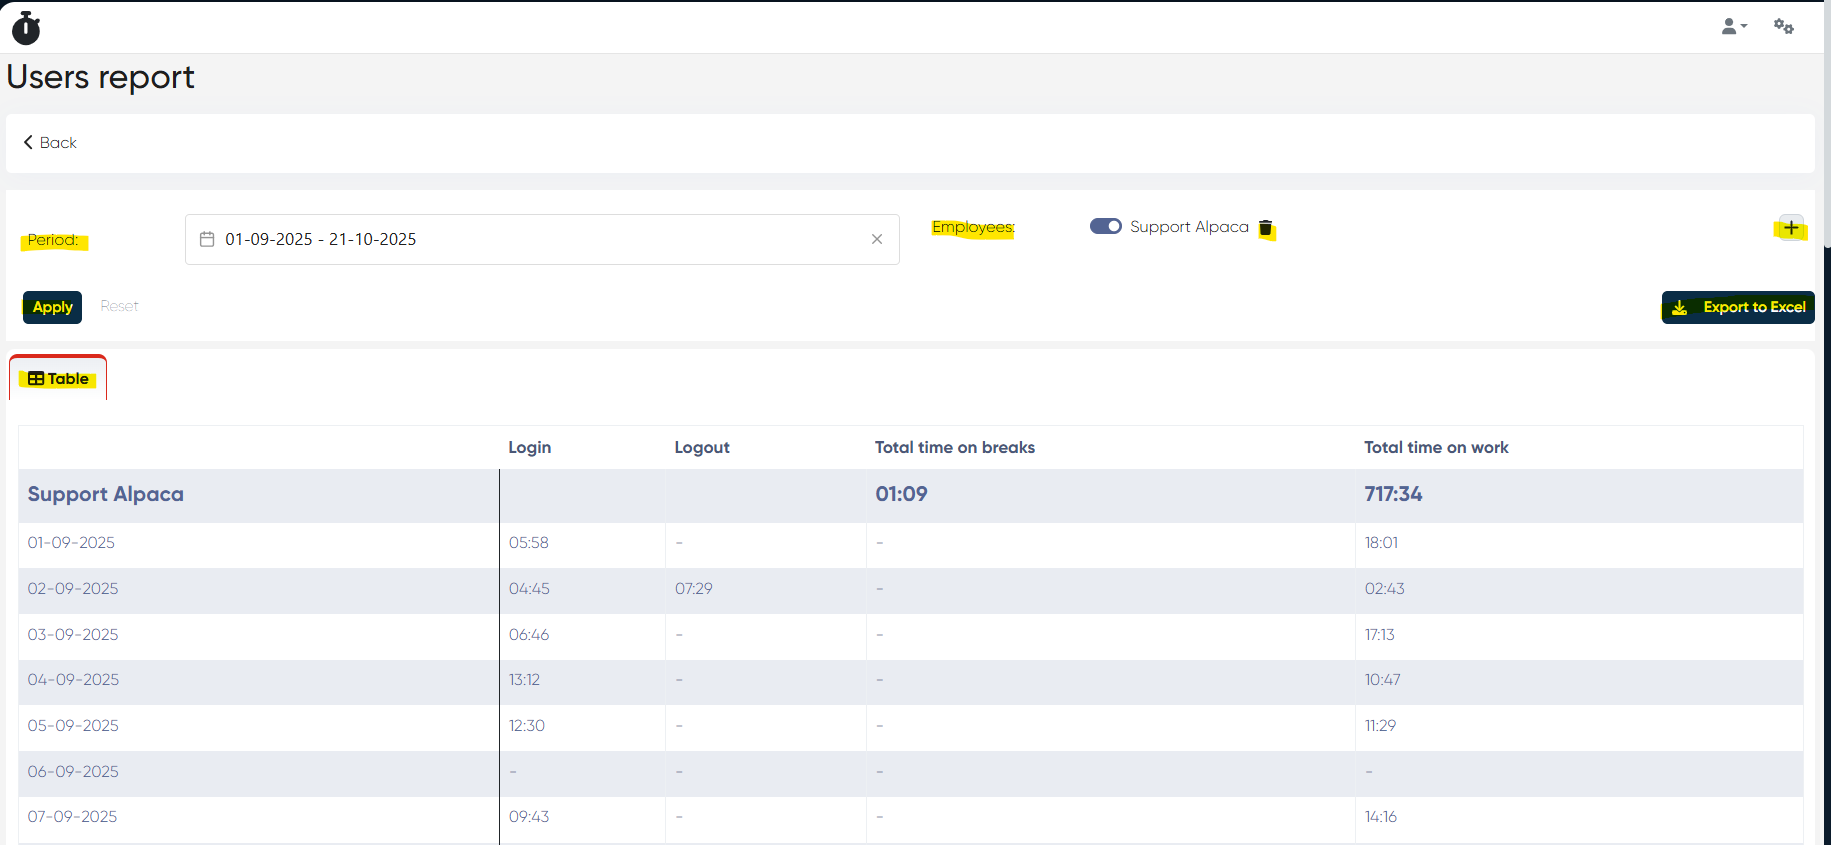
3. Users Report
Navigation: Analytics > Users Report
Shows employee activity: working hours, breaks, and login patterns.
Filters and Controls
Period: via calendar
Employee Filter: + add users (Administrators of the system)
Apply / Reset / Export to Excel
Report Table
Column
Description
Login / Logout
Session timestamps
Total Time on Breaks
Minutes away
Total Time on Work
Active session duration
Use case: Measure staff performance and adherence to work schedules.
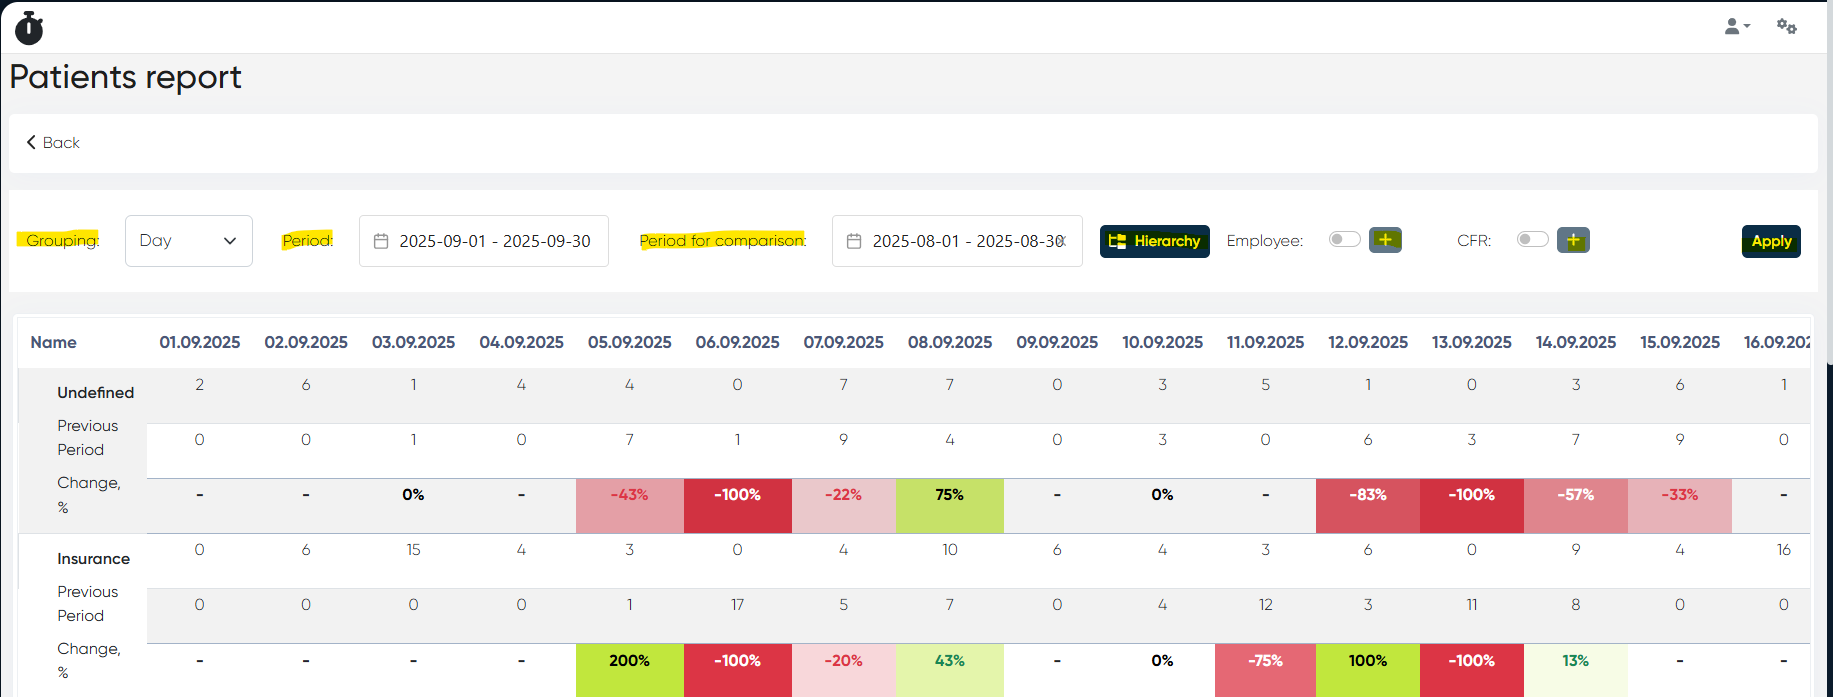
4. Patients Report
Navigation: Analytics > Patients Report
Displays patient inflow statistics and comparison across periods.
Shows total patient counts, previous-period comparison, and % change (highlighted by color).
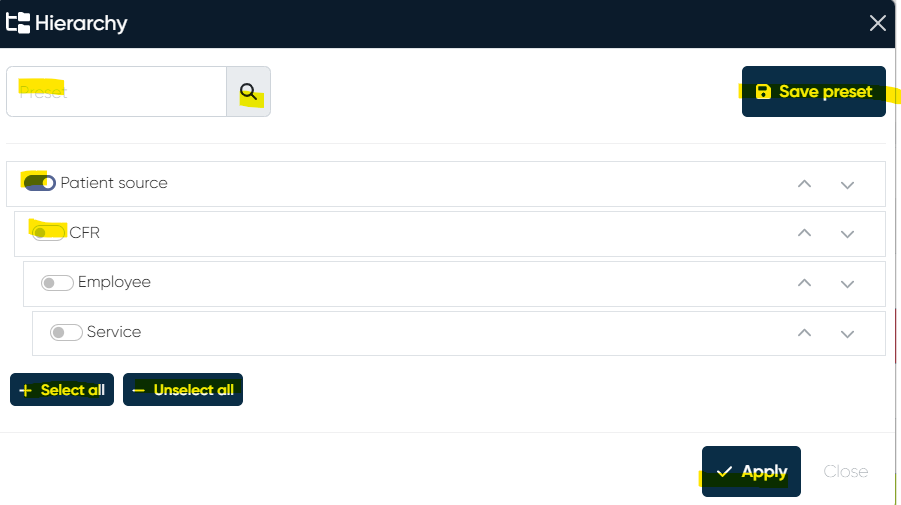
Tip: How to use Hierarchy settings Click Hierarchy to open the configuration window. You can select or deselect components (e.g., Employee, Service, CFR), reorder them by drag-and-drop, and click Save preset to reuse the structure in future sessions.
Use case: Monitor patient acquisition and growth trends.
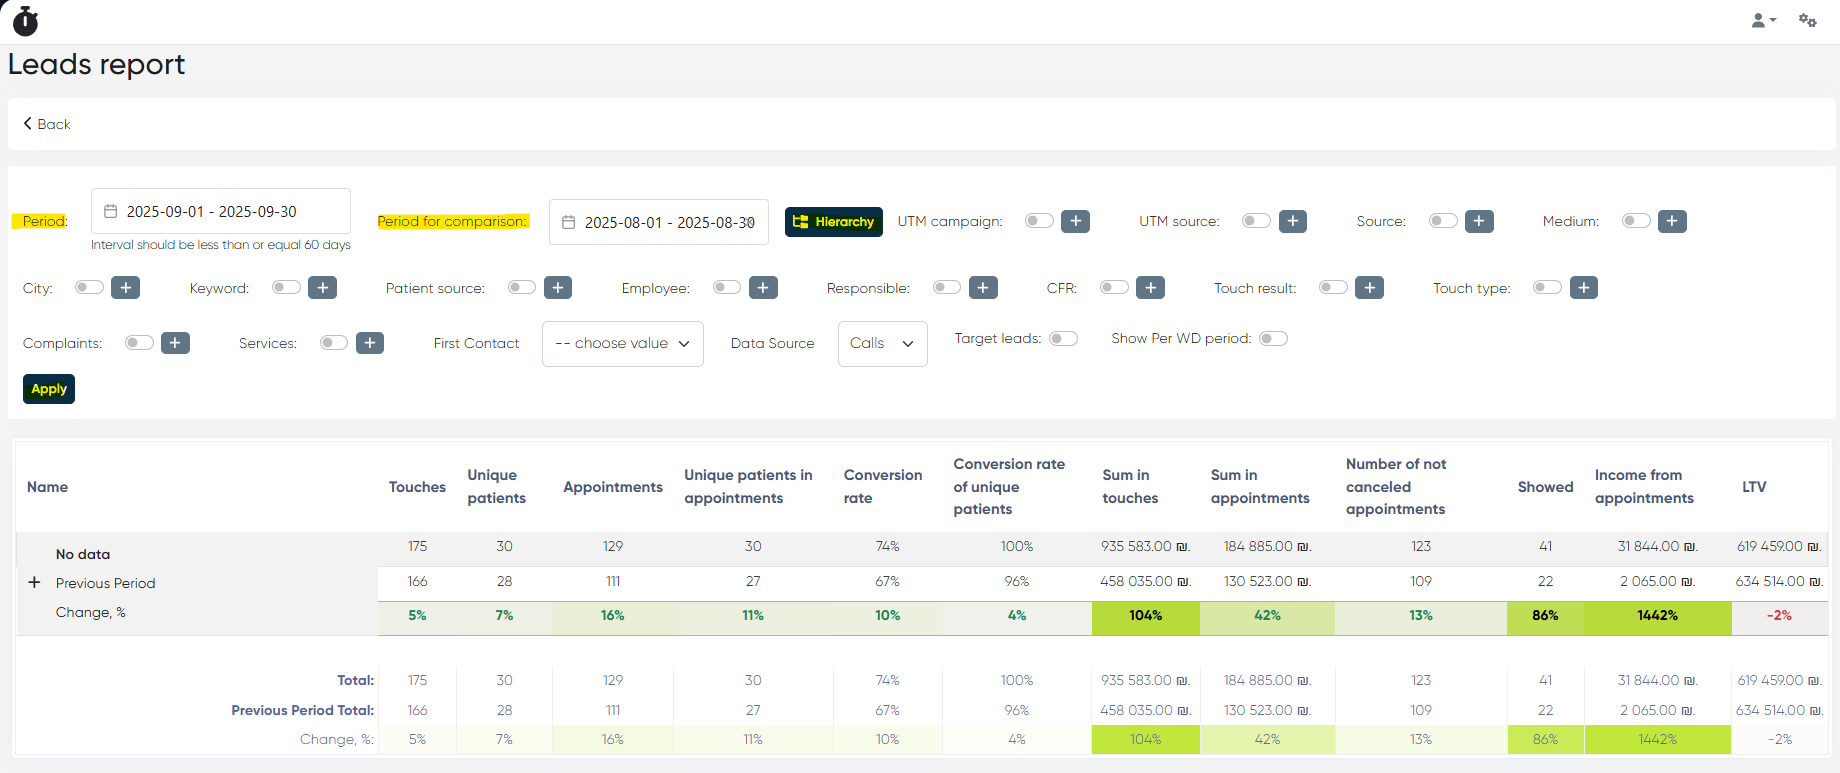
5. Leads Report
Navigation: Analytics > Leads Report
Advanced marketing report tracking leads, UTM sources, and conversions.
Filters and Controls
Period / Comparison Period
Hierarchy: UTM parameters, Source, Medium, Employee, etc.
Tip: How to use Hierarchy settings Open the Hierarchy window to select metrics such as Source, Medium, Service, CFR, etc. Move them up or down to control grouping levels (e.g., Source → Employee → Service). Save presets to maintain report consistency between sessions.
Use case: Measure marketing campaign efficiency and ROI.
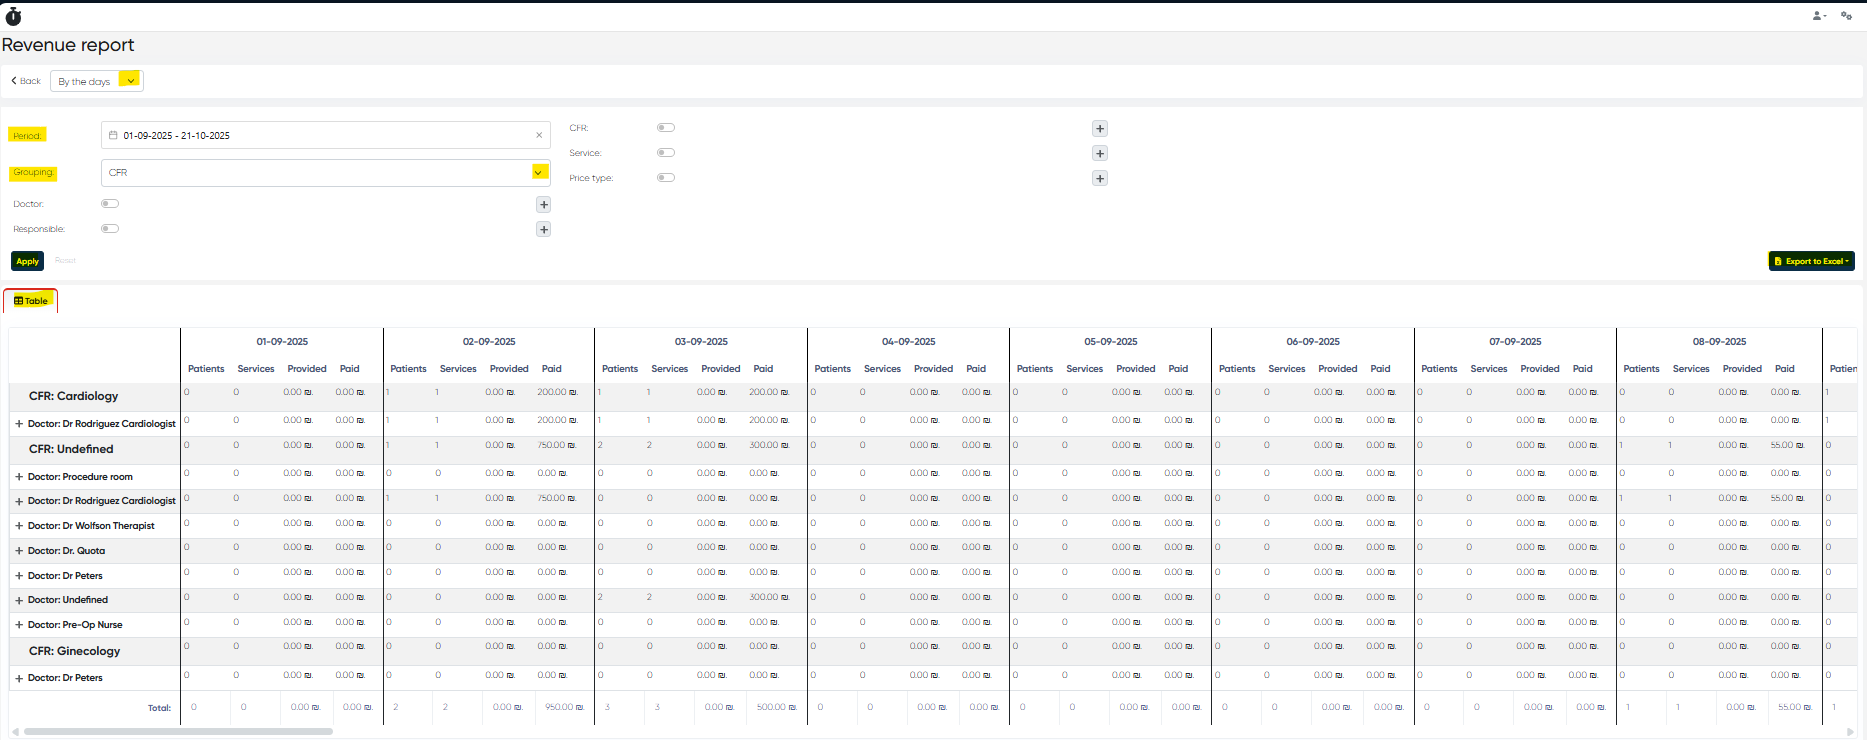
6. Revenue Report
Navigation: Analytics > Revenue Report
Tracks total revenue by service, doctor, and clinic department.
Filters and Controls
View: Days / Months / All period
Grouping: CFR / Service / etc.
Doctor / Responsible / CFR / Service / Price Type Filters
Apply / Reset / Export to Excel
Report Table
Summarizes provided and paid totals by selected hierarchy and period.
Tip: How to use Hierarchy settings Choose the most relevant grouping (e.g., CFR → Doctor → Service) to focus on financial responsibility and performance per provider.
Use case: Analyze income structure and identify the most profitable services.
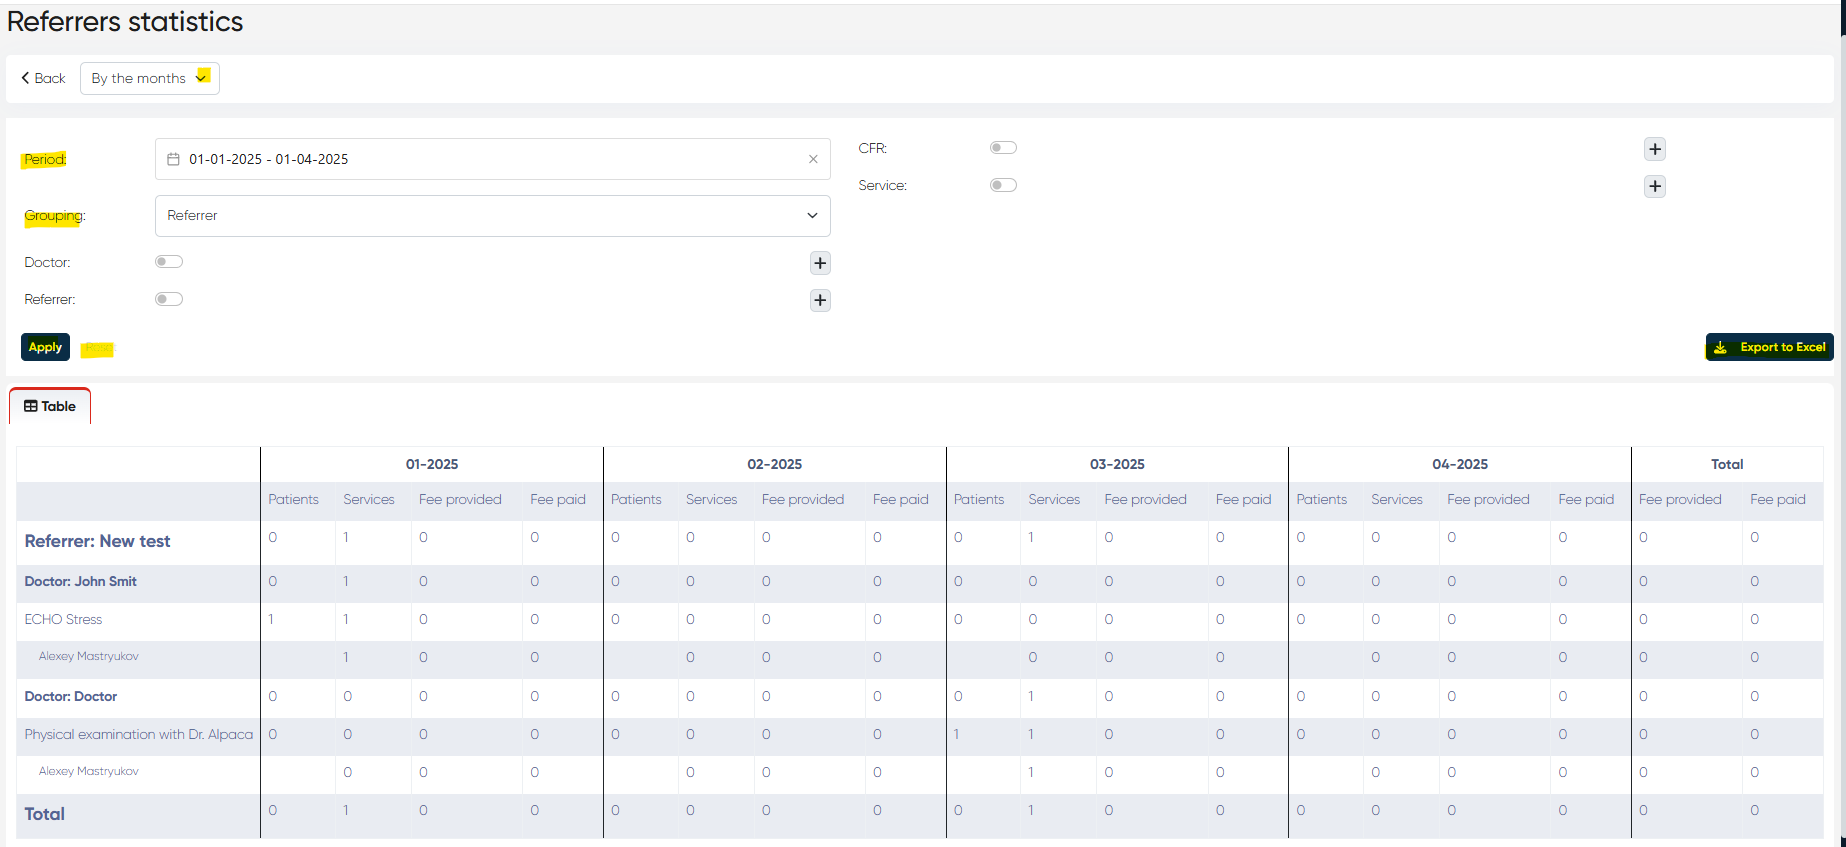
7. Referrers Statistics Report
Navigation: Analytics > Referrers Statistics
Monitors patient inflow via referrers and their financial outcomes.
Use case: Manage referral-based collaborations and track referral efficiency.
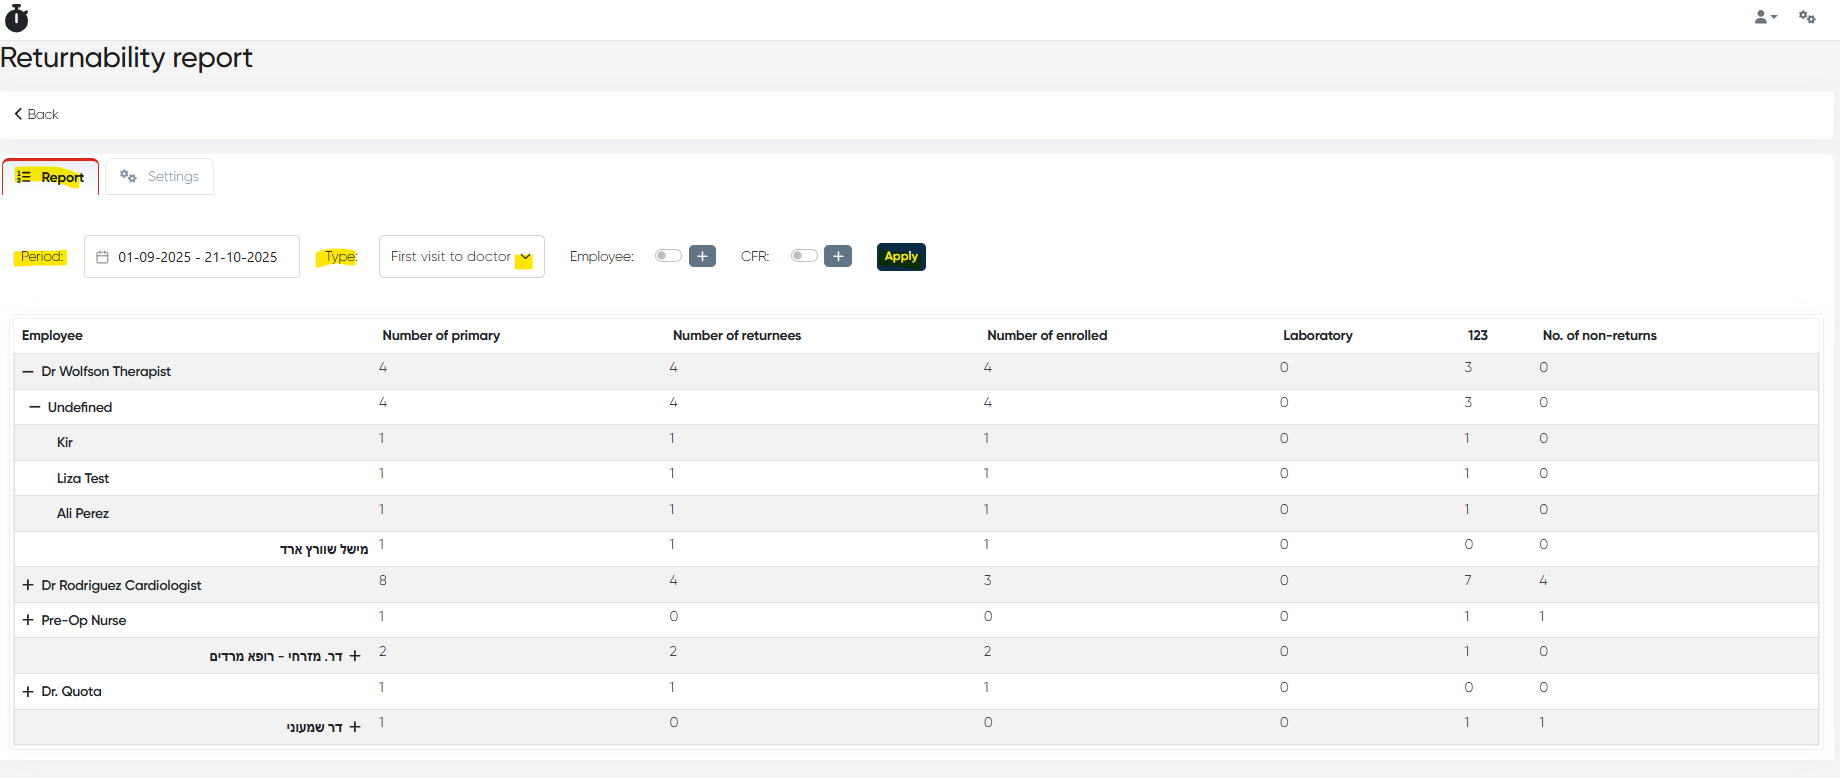
8. Returnability Report
Navigation: Analytics > Returnability Report
Evaluates patient loyalty and repeat visits.
Filters and Controls
Period: via calendar
Type: First visit to clinic / doctor
Employee / CFR Filters
Apply
Report Table
Shows primary, returning, and non-returning counts.
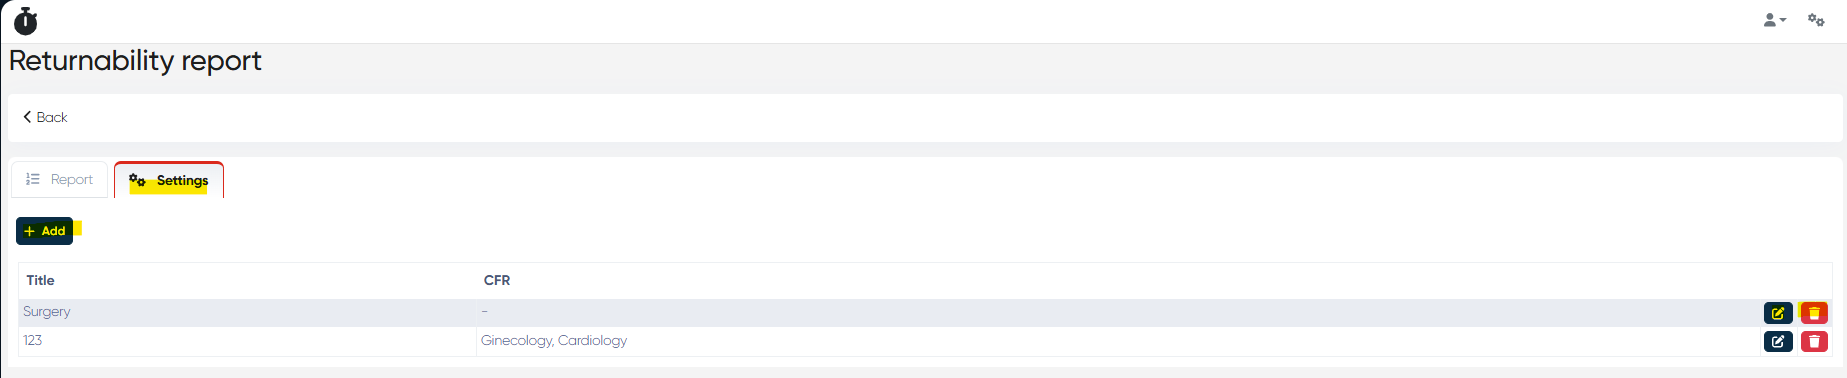
Settings Tab: Create and edit CFR groups to categorize doctors for reporting.
Tip: How to use Settings Use the Settings tab to create logical CFR groups (e.g., General Medicine, Aesthetics). These can then be used as top-level report filters.
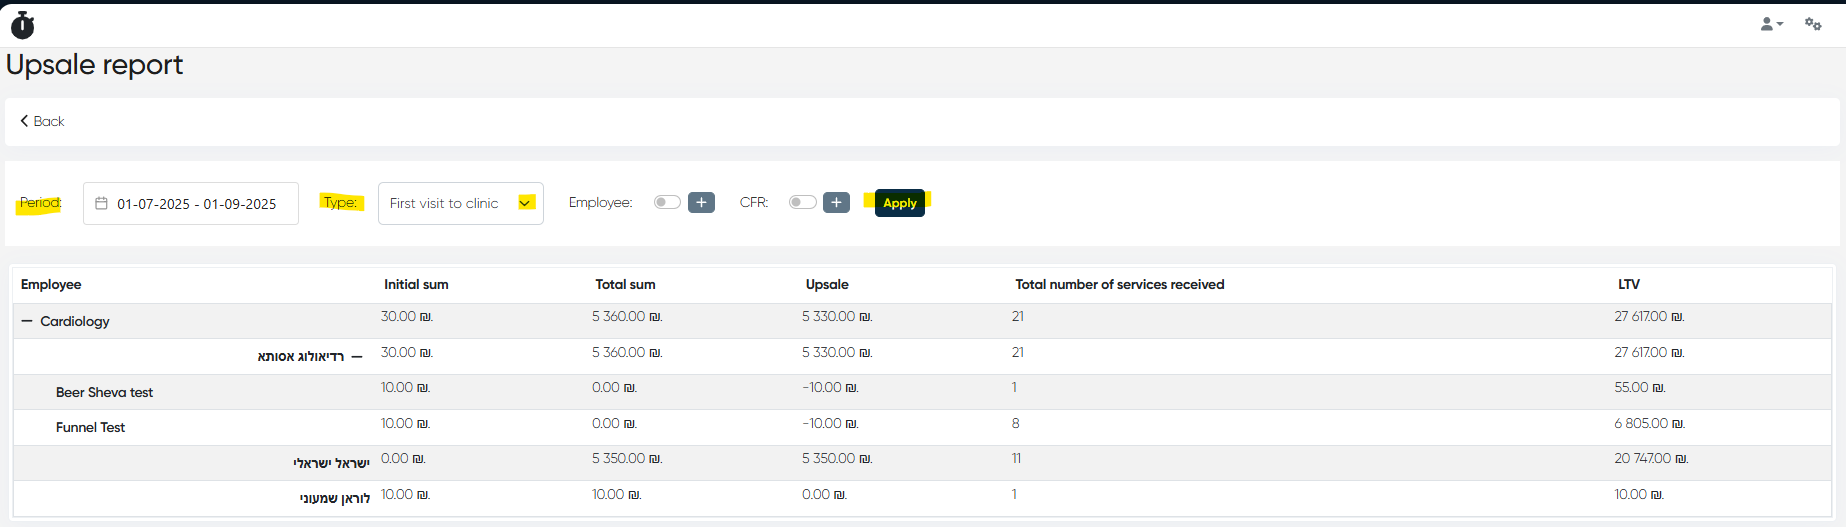
9. Upsale Report
Navigation: Analytics > Upsale Report
Analyzes revenue growth from patients after their first visit.
Filters and Controls
Period: via calendar
Type: First visit to clinic / doctor
Employee / CFR Filters
Apply
Report Table
| Initial Sum | Total Sum | Upsale | Services Count | LTV |
Hierarchy: CFR → Employee → Patient
Use case: Assess employees’ ability to retain and upsell to patients.
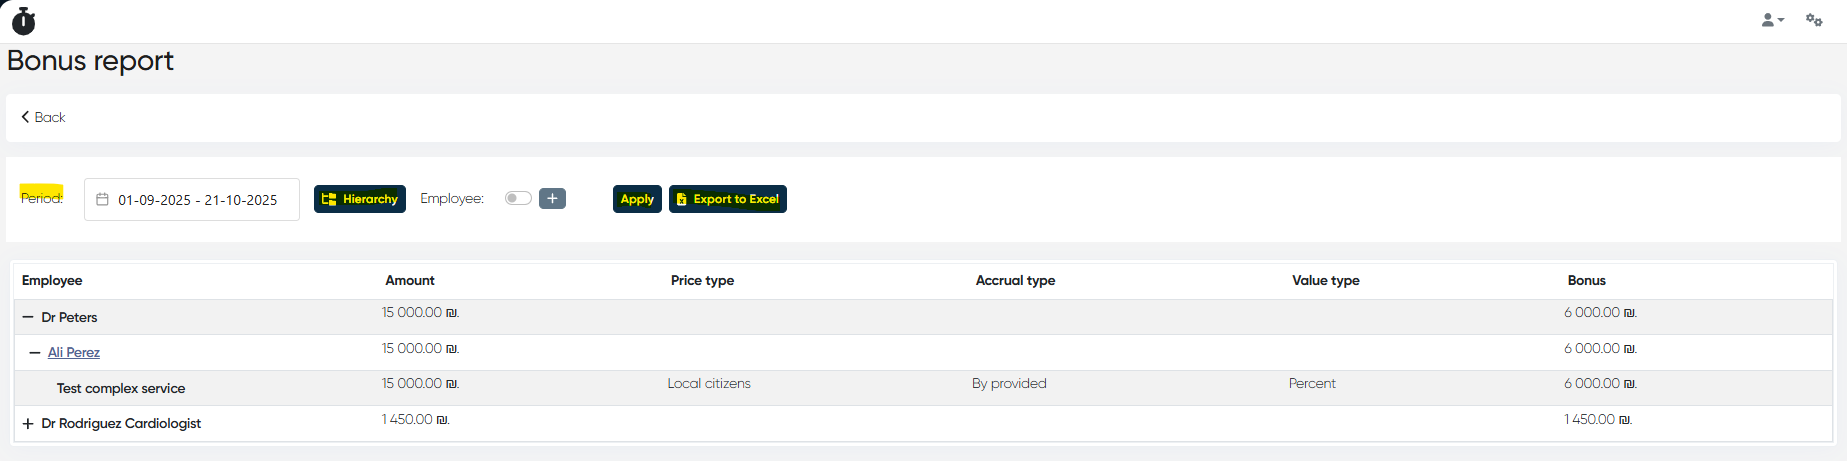
10. Payments to Doctors (Bonus) Report
Navigation: Analytics > Payments to Doctors
Calculates bonus and commission payments for medical staff.
Filters and Controls
Period: via calendar
Hierarchy Settings: Patient / Service
Employee Filter / Apply / Export to Excel
Report Table
| Amount | Price Type | Accrual Type | Value Type | Bonus |
Hierarchy: Employee → Patient → Service
Tip: How to use Hierarchy settings Use Hierarchy to view bonuses grouped by patient or service. Example: Employee → Service → Patient shows total bonuses per doctor per procedure.
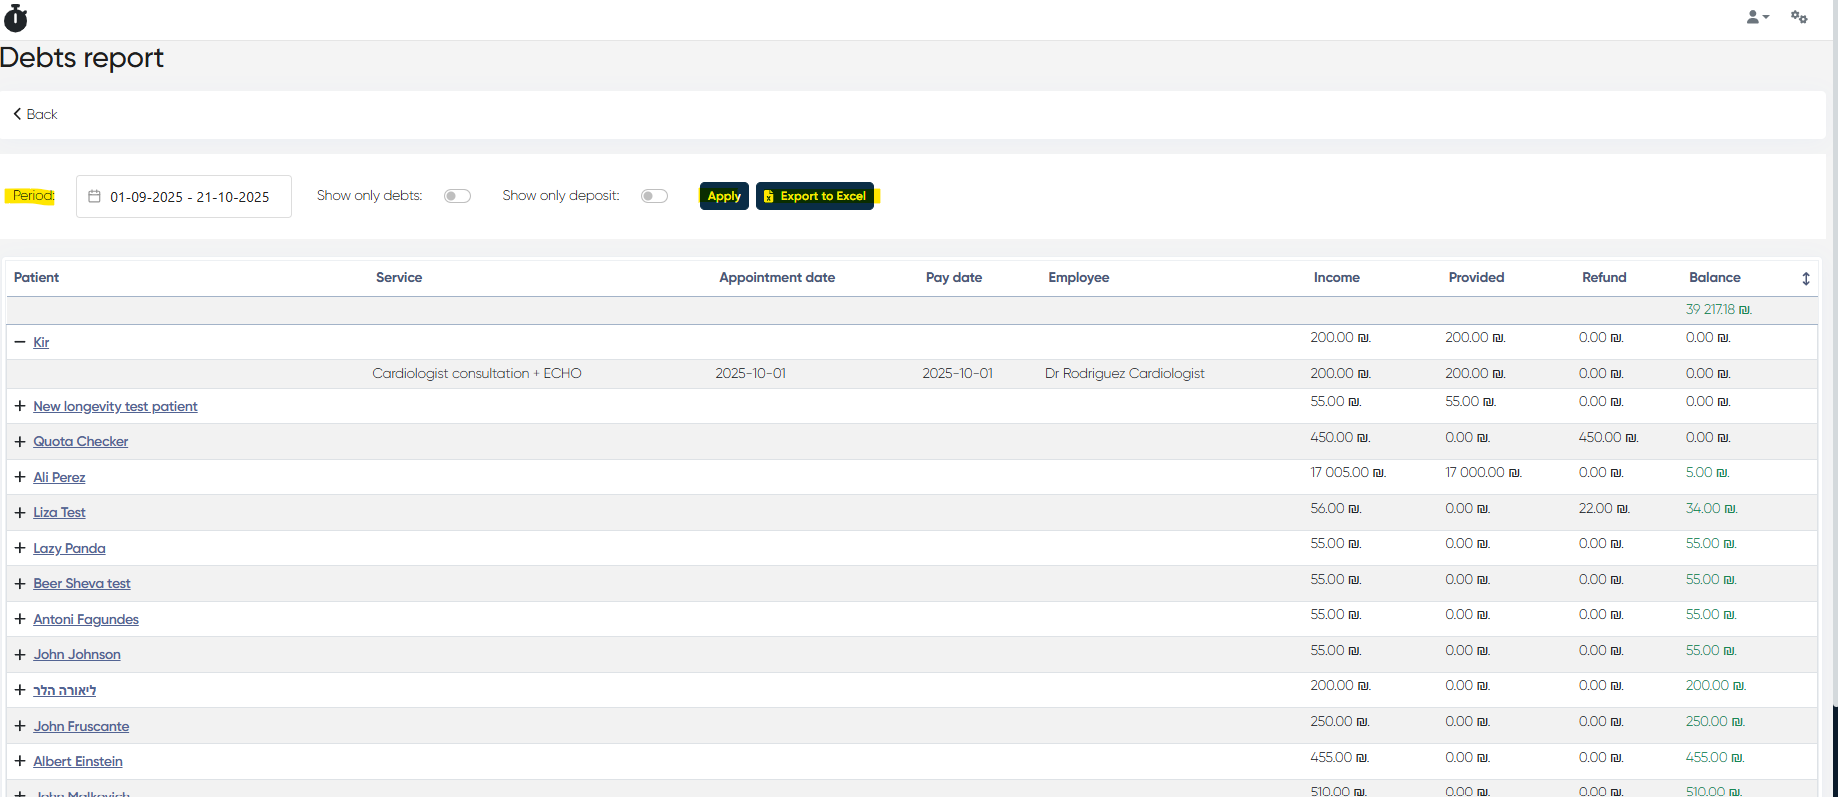
11. Debts Report
Navigation: Analytics > Debts Report
Displays patients’ outstanding balances and deposits.
Filters and Controls
Period: via calendar
Show only Debts / Deposits.
Apply / Export to Excel
Report Table
| Patient | Service | Appointment Date | Pay Date | Employee | Income | Provided | Refund | Balance |
Use case: Manage overdue accounts and pending payments.
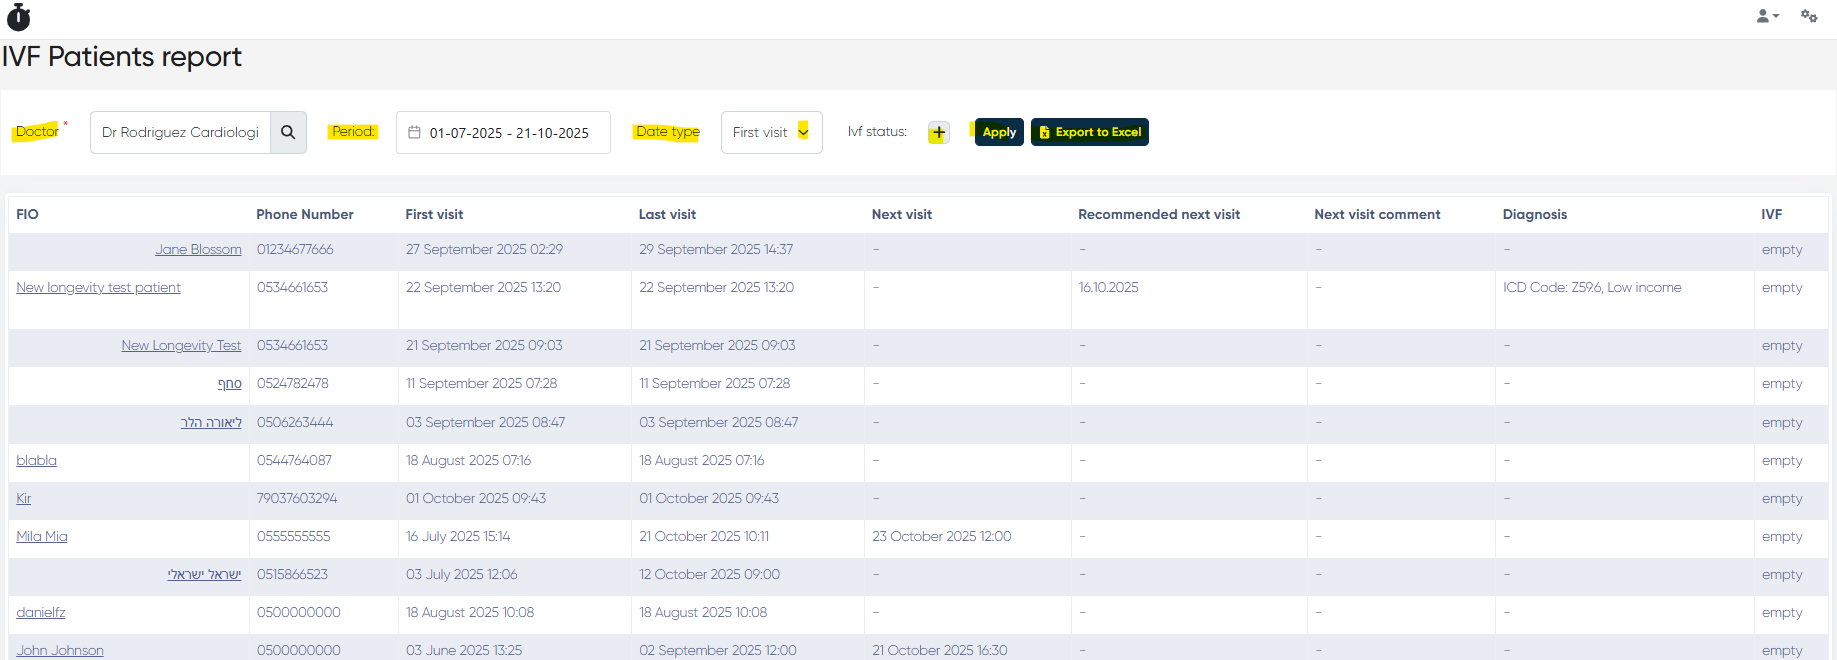
12. IVF Patients Report
Navigation: Analytics > IVF Patients Report
Tracks patients enrolled in IVF programs and their appointment history.
Filters and Controls
Doctor: mandatory
Period / Date Type: First or Last visit
IVF Status Filter
Apply / Export to Excel
Report Table
| Patient | Phone | First Visit | Last Visit | Next Visit | Recommended | Comment | Diagnosis | IVF Status |
Use case: Oversee treatment progress and scheduling for IVF cases.
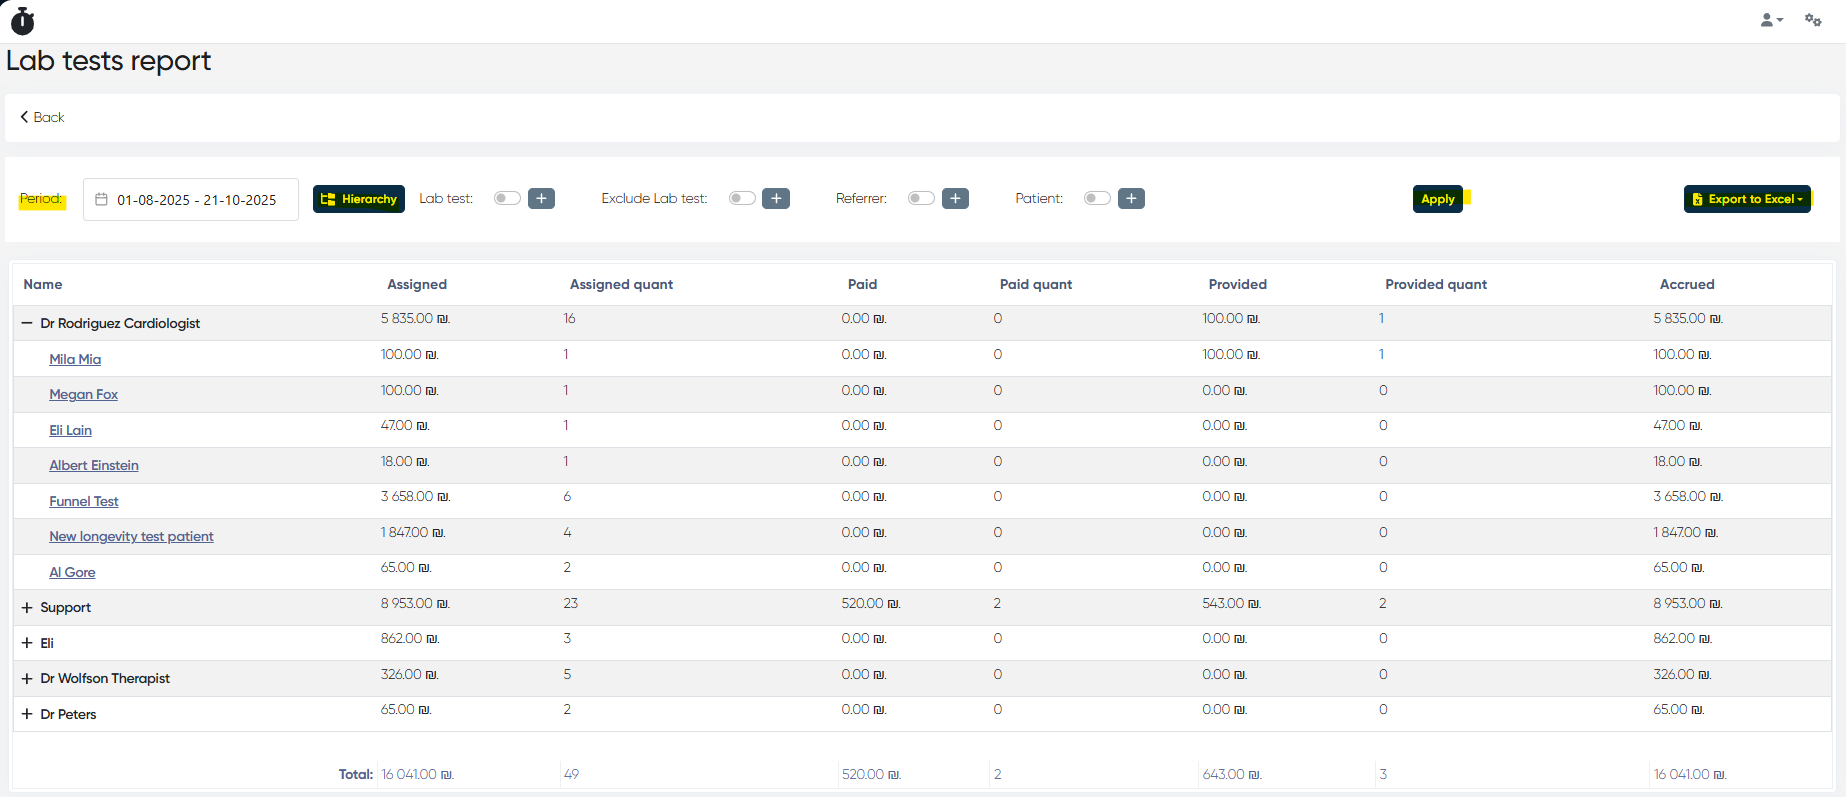
13. Lab Tests Report
Navigation: Analytics > Lab Tests Report
Analyzes lab test volume, billing, and performance.
Filters and Controls
Period: via calendar
Hierarchy: Responsible / Patient / Lab Test
Include / Exclude Lab Tests, Referrer, Patient Filters
Tip: How to use Hierarchy settings Reorganize components (e.g., Lab Test → Responsible → Patient) to view performance per test type or responsible staff.
Use case: Evaluate lab productivity and revenue per test.
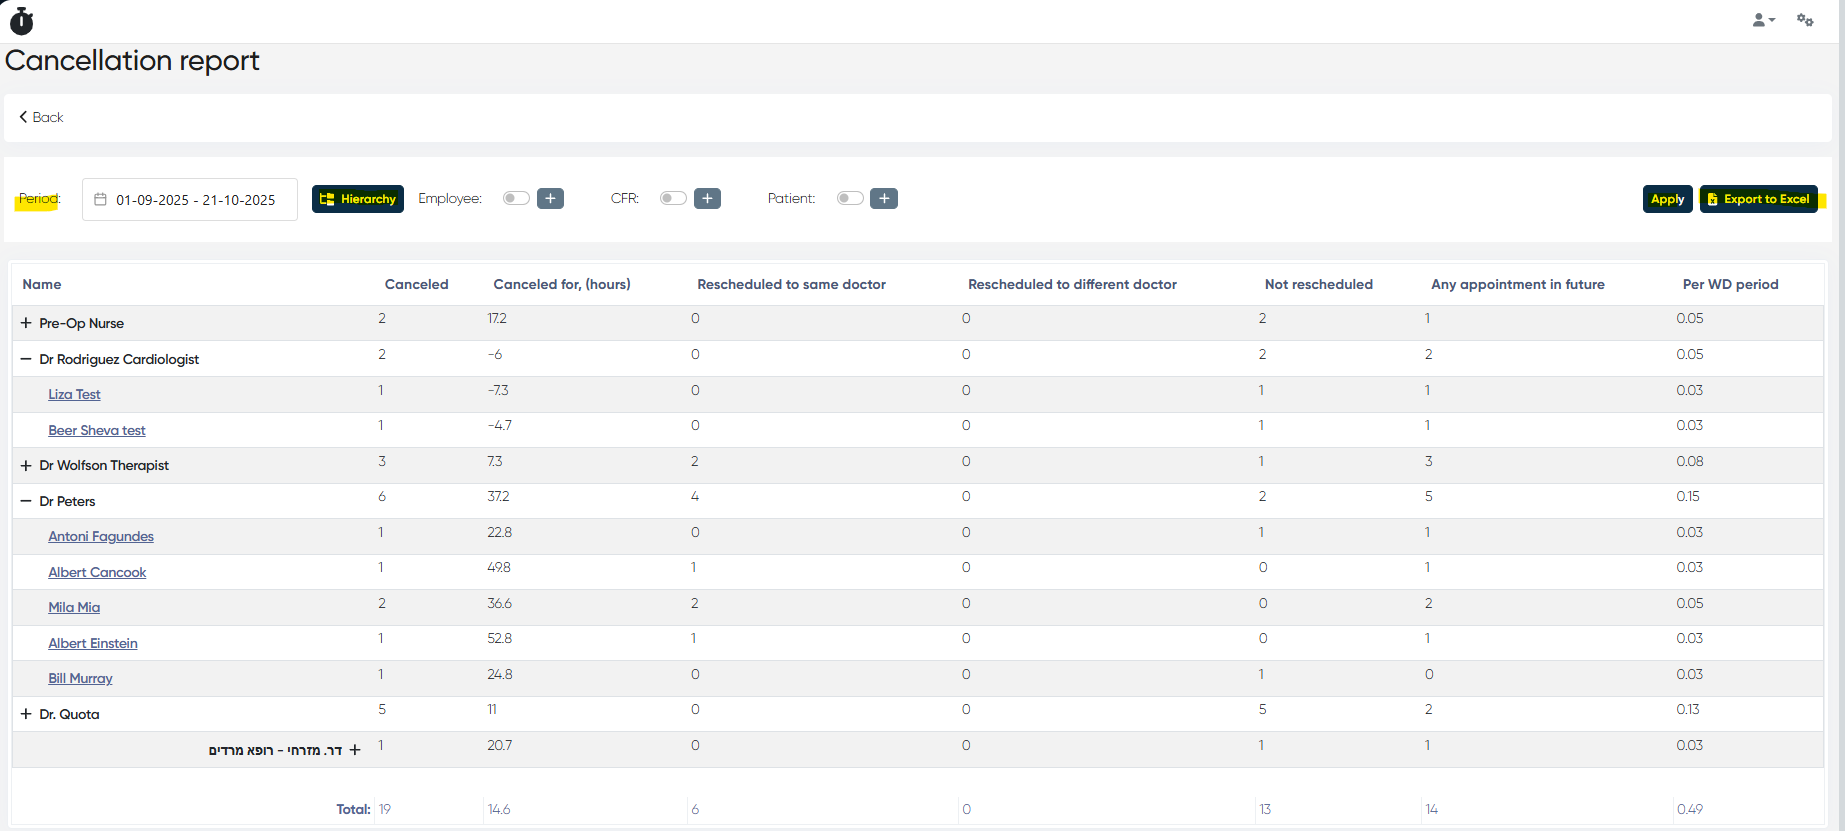
14. Cancellation Report
Navigation: Analytics > Cancellation Report
Displays cancellations, rescheduling behavior, and future rebookings.
| Name | Canceled | Canceled For (hours) | Rescheduled (Same/Different) | Not Rescheduled | Future Appointment | Per WD |
Tip: How to use Hierarchy settings Configure Employee → Reason → Patient to identify common causes of cancellations per staff member.
Use case: Reduce cancellation rates and detect problem areas.
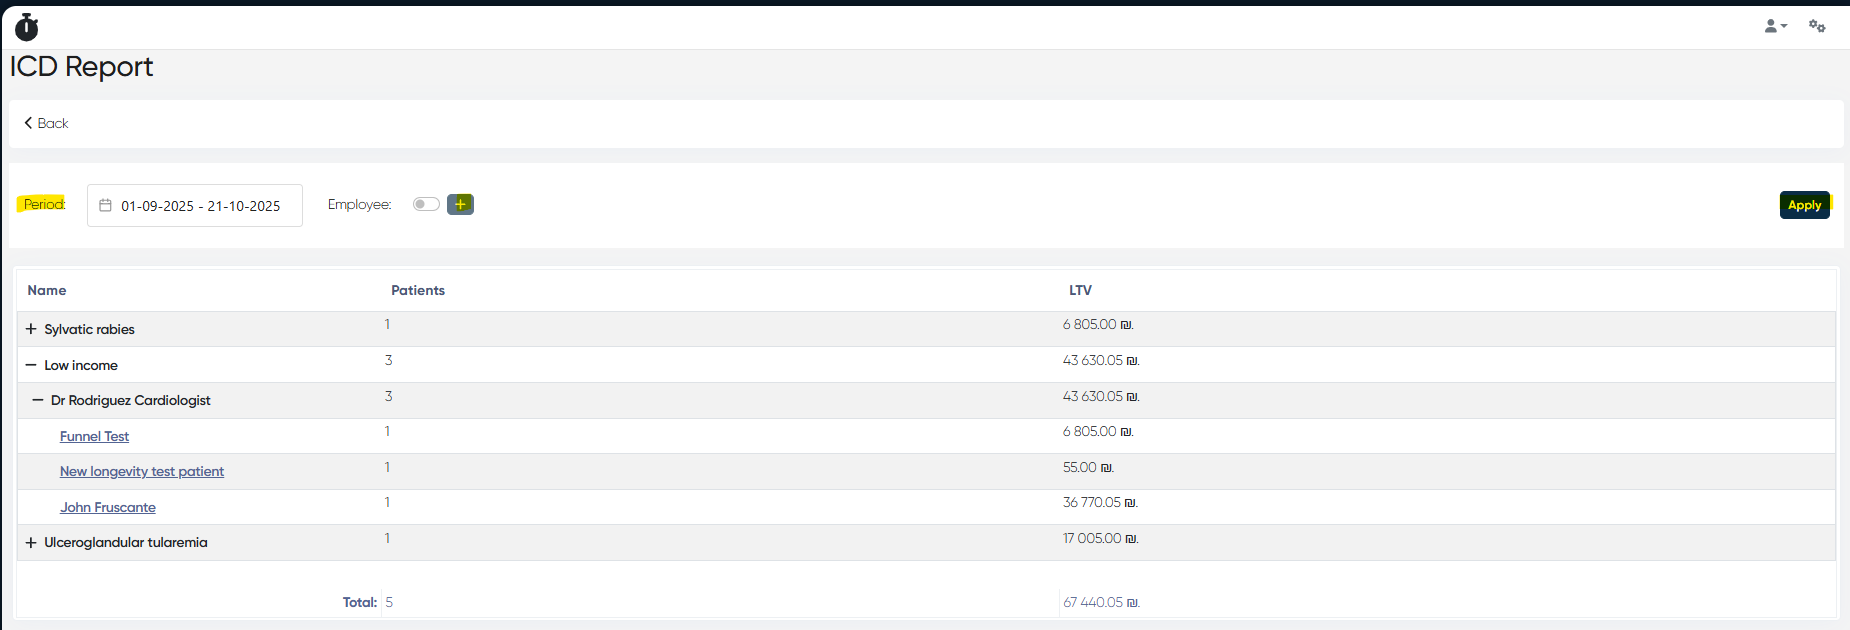
15. ICD Report
Navigation: Analytics > ICD Report
Summarizes patient diagnoses by ICD code.
Filters and Controls
Period: via calendar
Employee Filter / Apply
Report Table
| ICD Code | Patients | LTV |
Hierarchy: ICD → Employee → Patient
Use case: Review case distribution by diagnosis and related revenue.
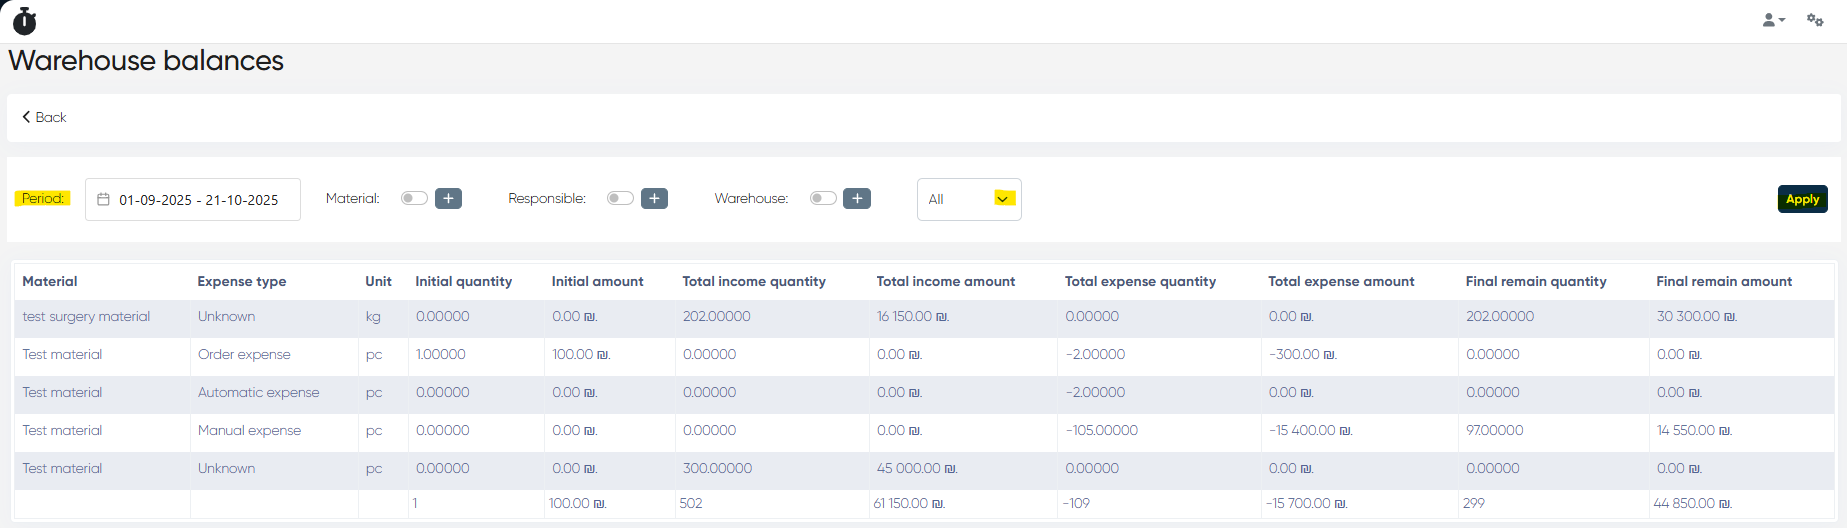
16. Warehouse Balances Report
Navigation: Analytics > Warehouse Balances
Tracks incoming, outgoing, and remaining quantities of materials.
Filters and Controls
Period: via calendar
Material / Responsible / Warehouse Filters
Type: All / Services / Lab Tests
Apply
Report Table
| Material | Unit | Initial Qty / Amount | Income Qty / Amount | Expense Qty / Amount | Final Qty / Amount |
Use case: Monitor material consumption and balance status by warehouse.
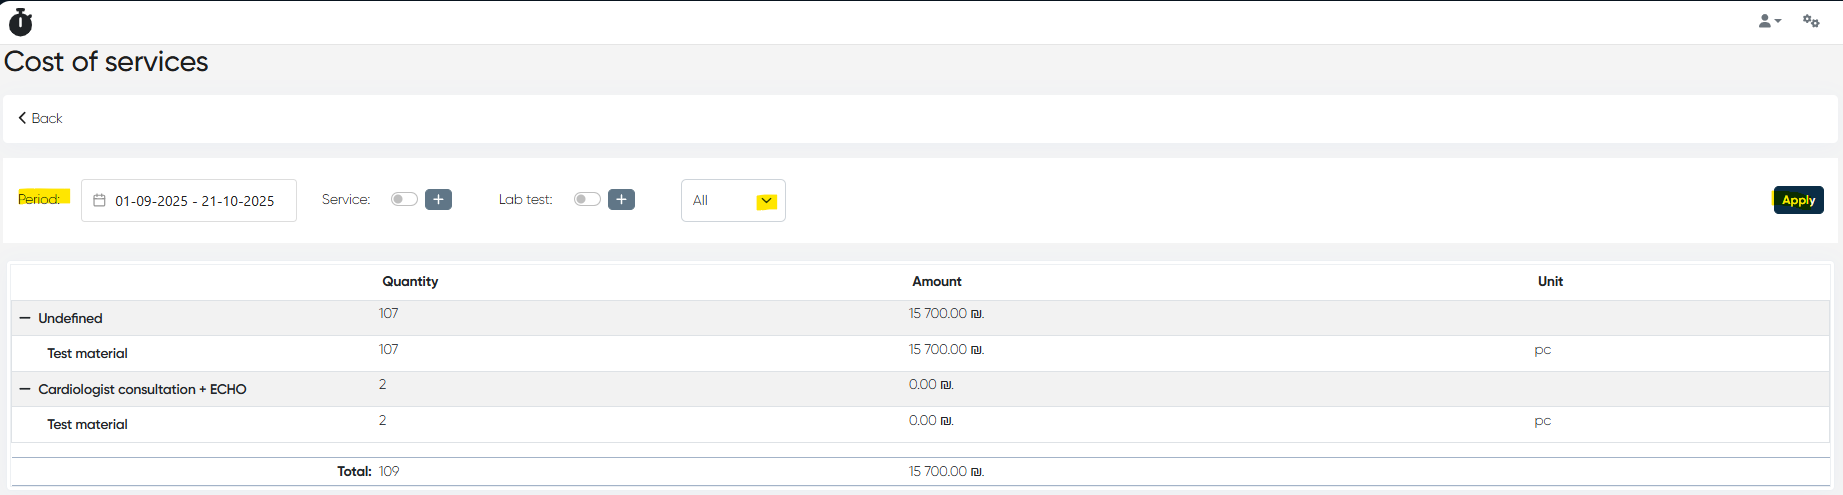
17. Cost of Services Report
Navigation: Analytics > Cost of Services
Calculates the cost of materials consumed per service or lab test.
Filters and Controls
Period: via calendar
Service / Lab Test Filters
Type Dropdown: All / Services / Lab Tests
Apply
Report Table
| Service / Lab Test | Quantity | Amount | Unit |
Hierarchy: Service/Lab Test → Materials
Use case: Track actual cost vs revenue to evaluate service profitability.
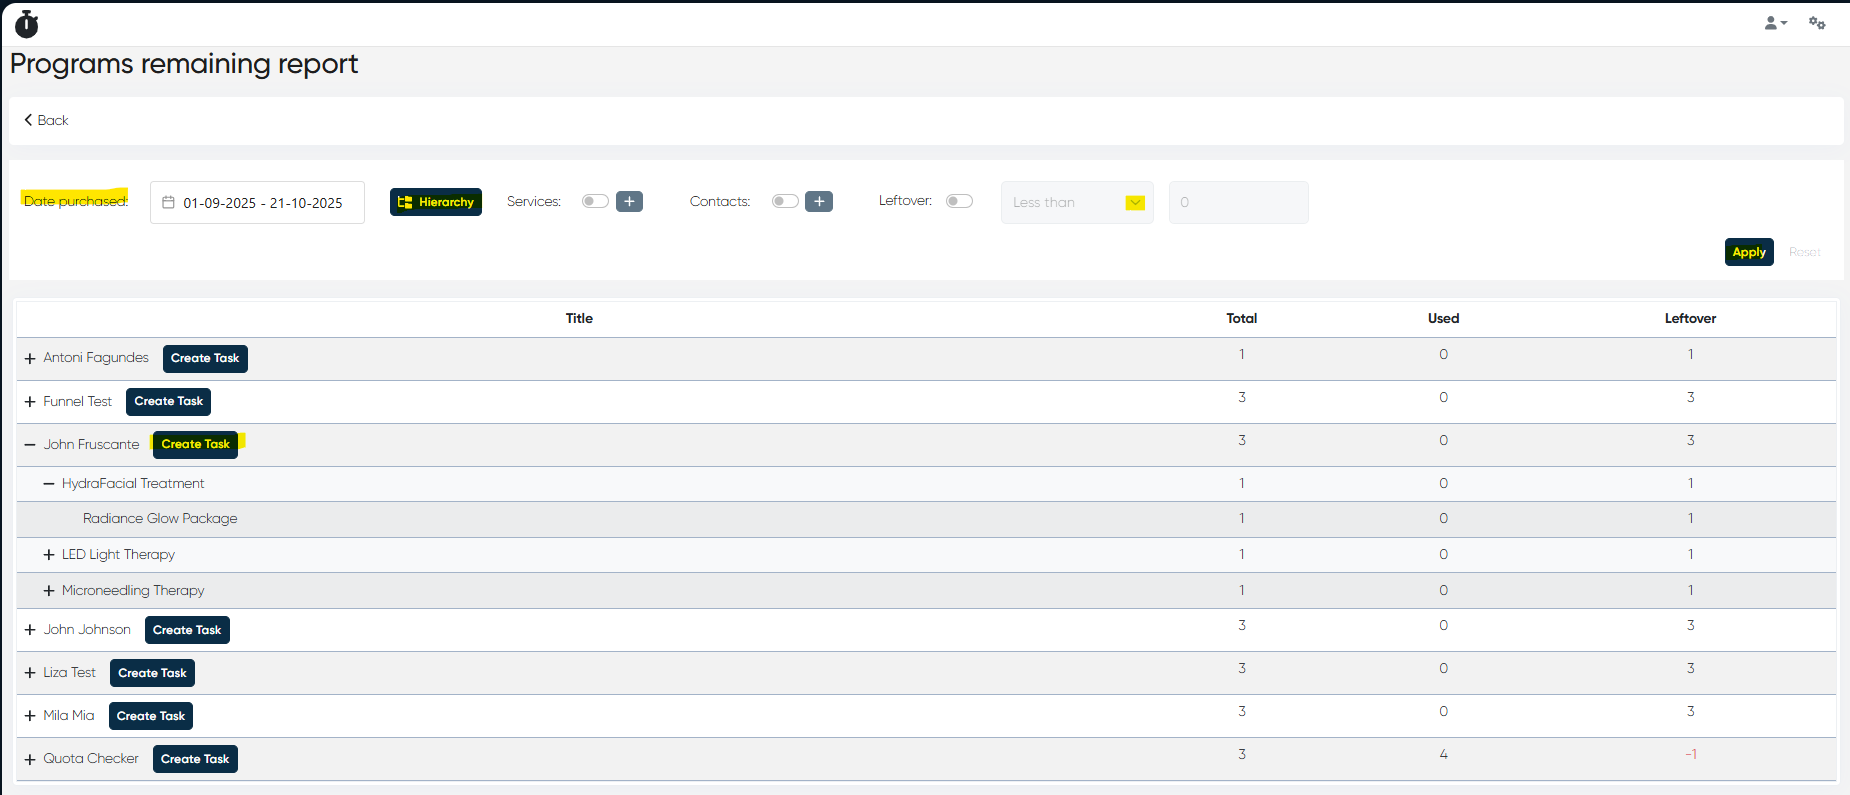
18. Programs Remaining Report
Navigation: Analytics > Programs Remaining
Shows remaining sessions in prepaid or package programs.
Filters and Controls
Date Purchased: via calendar
Hierarchy: Patient / Service / Complex Service
Service / Contact / Leftover Filters (less/more than)
Apply / Reset
Report Table
| Title | Total | Used | Leftover |
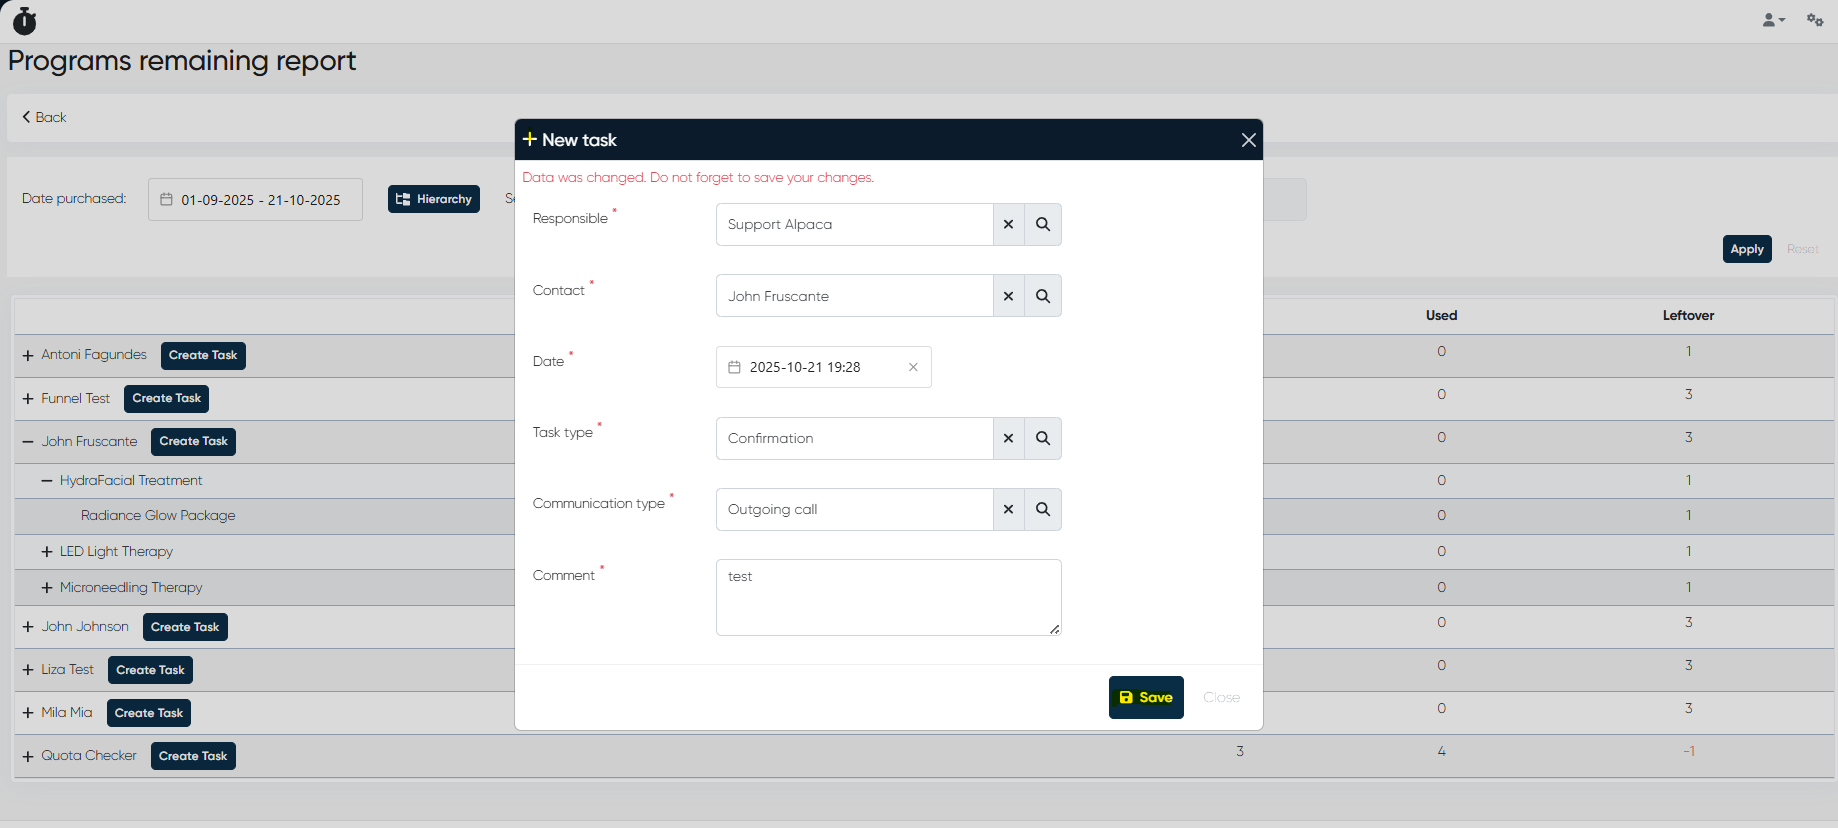
Feature: Create a task for each patient with remaining sessions directly from the report.
Tip: How to use Hierarchy settings Adjust the order (e.g., Service → Patient or Patient → Complex Service) to focus either on service utilization or patient retention.
Use case: Manage prepaid balance usage and plan reactivation campaigns.
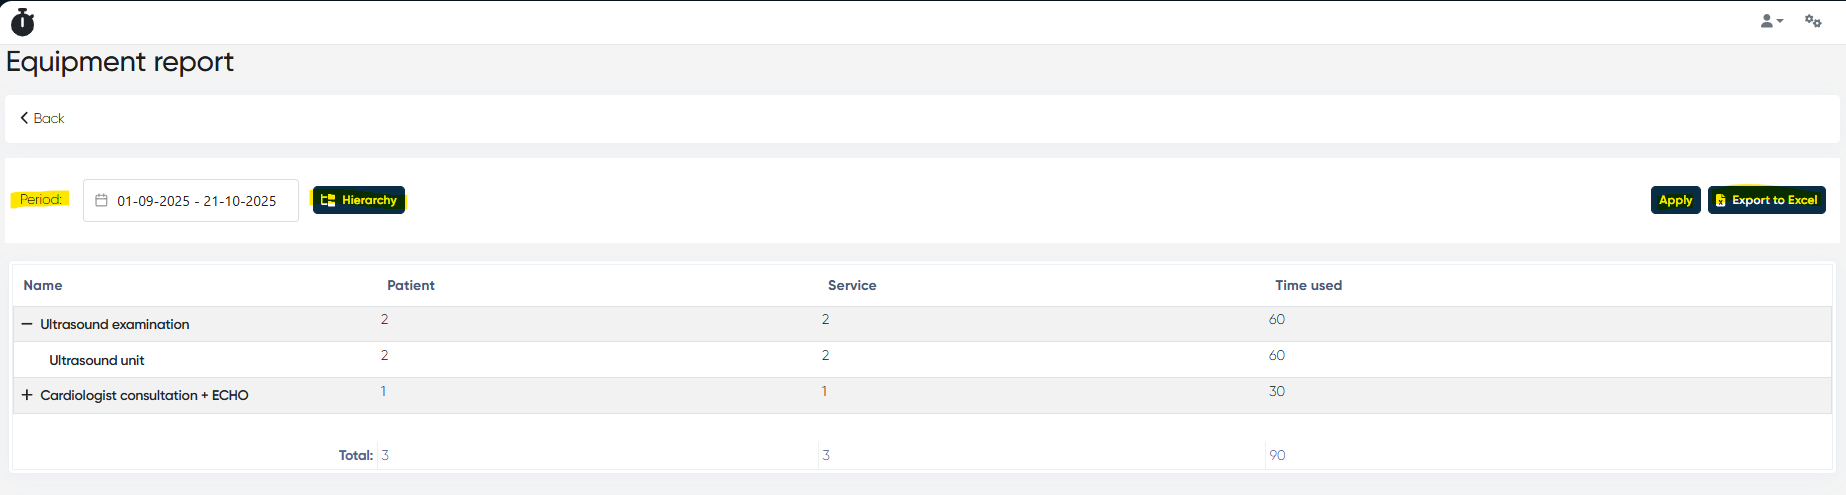
19. Equipment Report
Navigation: Analytics > Equipment Report
Summarizes the usage time of equipment linked to medical services.
Filters and Controls
Period: via calendar
Hierarchy: Service / Equipment / Doctor
Apply / Export to Excel
Report Table
| Equipment | Patients | Service | Time Used (min) |
Tip: How to use Hierarchy settings Use Service → Equipment → Doctor to analyze which services consume the most machine time and plan preventive maintenance.
Use case: Optimize resource utilization and reduce equipment downtime.
Key Benefits
Unified data structure for operational, financial, and marketing reports
Advanced filter combinations with hierarchy-based grouping
Excel export for all report types
Real-time synchronization with clinic data
Comparative analytics and visual change indicators
Preconfigured presets for quick reuse
Summary
The Analytics and Reports section is the core analytical engine of the system, designed to provide a 360° view of all operations — from leads and calls to revenue, costs, and resource utilization. By leveraging customizable hierarchies, multi-criteria filters, and comparative period analysis, clinics can transform operational data into actionable insights that support growth and informed decision-making.
JavaScript errors detected
Please note, these errors can depend on your browser setup.
If this problem persists, please contact our support.